Methodology: How the Simulator Calculates Nuclear Effects
Everything the simulator draws on the map is calculated from openly published, declassified models of nuclear weapons effects. This page explains where the numbers come from and what assumptions they rely on.
Primary sources
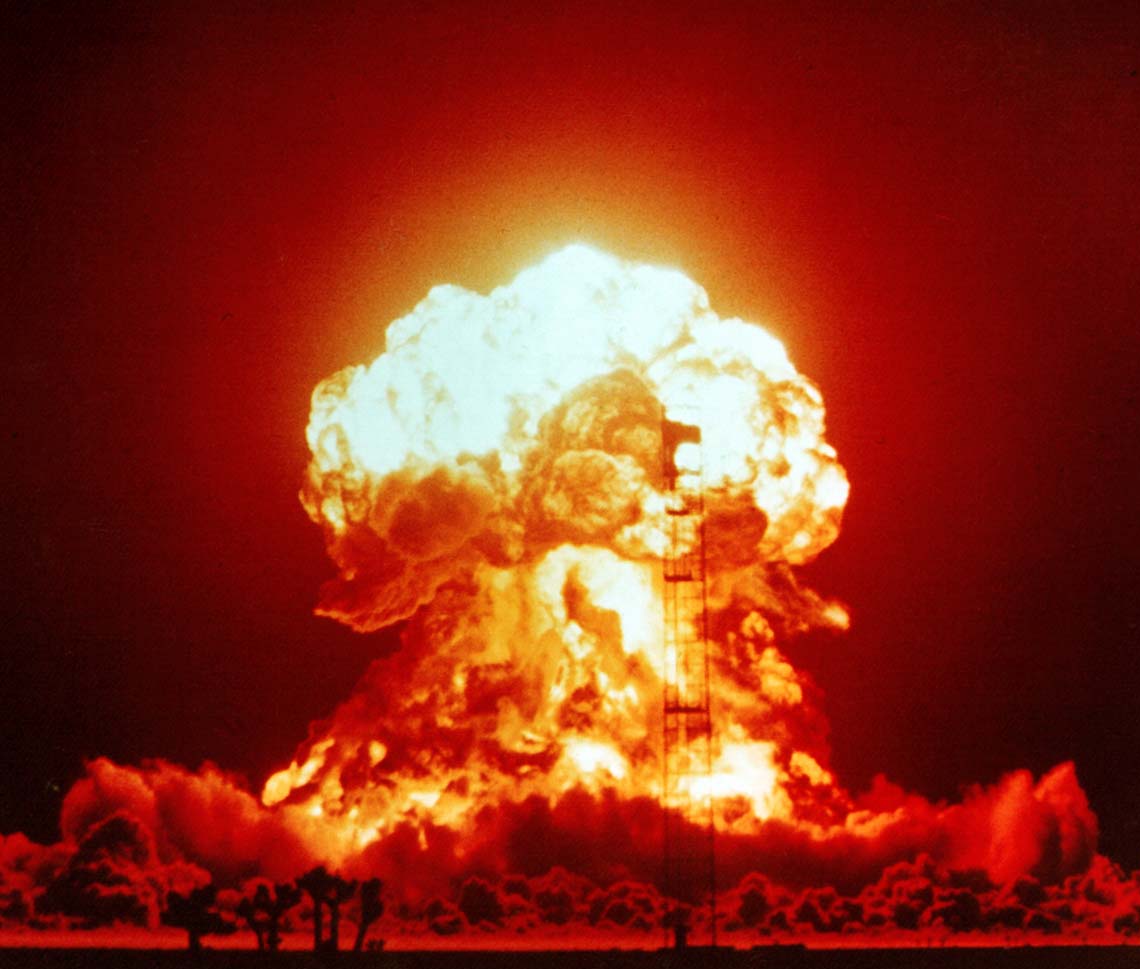
The core reference is The Effects of Nuclear Weapons by Samuel Glasstone and Philip J. Dolan (3rd edition, 1977) — the standard, formerly official U.S. government compendium of nuclear effects data, long since declassified and freely available. Supplementary relationships come from E. Royce Fletcher's scaling work, the U.S. Office of Technology Assessment's The Effects of Nuclear War (1979) and the openly documented equations popularised by Alex Wellerstein's NUKEMAP project.
Blast overpressure
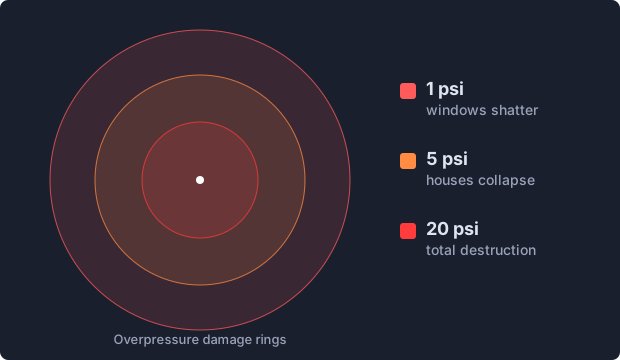
Blast damage is expressed in psi (pounds per square inch) of overpressure. Distances scale with the cube root of yield (Hopkinson–Cranz scaling): a bomb 8× more powerful pushes each pressure ring only 2× farther. The simulator's default rings correspond to well-established damage benchmarks: 20 psi — reinforced concrete buildings destroyed, fatalities approach 100%; 5 psi — most residential buildings collapse; 1 psi — window glass breaks, causing injuries. For airbursts, the model can optimise the height of burst to maximise the radius of any chosen overpressure.
Thermal radiation
The thermal rings show the slant-range distance at which the heat pulse delivers enough energy (in cal/cm²) to cause first-, second- or third-degree burns with a given probability, or to ignite dry wood. The required energy grows slowly with yield because larger explosions emit their pulse over a longer time. The model assumes reasonably clear atmospheric visibility; haze, clouds and shadows change real-world results significantly.
Ionizing radiation
The radiation rings show the distance at which a prompt dose (in rem) is delivered by the initial burst of neutrons and gamma rays. Doses of 500–600 rem are usually fatal without intensive medical care. For large-yield weapons the lethal blast and thermal radii extend far beyond the prompt radiation radius, which is why this effect matters most for small, Hiroshima-class weapons.
Fallout
The fallout plume is modelled for surface bursts (an airburst whose fireball never touches the ground produces little local fallout). Inputs are yield, fission fraction, wind speed and direction; the output is a set of dose-rate contours in rads per hour, referenced to one hour after detonation («H+1»), following the simplified SIMFIC-style approach described in openly published literature. Real fallout patterns are far messier — they depend on winds at every altitude, rain and terrain.
Terrain and buildings
Every ring on the map is calculated for flat, open ground, which is also how the classic reference models are built. Real landscapes change the picture. The heat flash travels in straight lines, so anything behind a ridge or a solid building is shielded from burns, while exposed slopes facing the fireball can be hit harder. The blast wave bends around obstacles, but hills still weaken it on their far side, and valleys and long straight streets can channel it. Nagasaki is the textbook example: the bomb exploded over the Urakami valley, and the surrounding hills confined much of the destruction, so the city centre behind them was damaged far less than the rings alone would suggest. Dense high-rise districts add their own shielding and debris. Treat the rings as an estimate of scale for an idealised flat city, not as a street-by-street damage map.
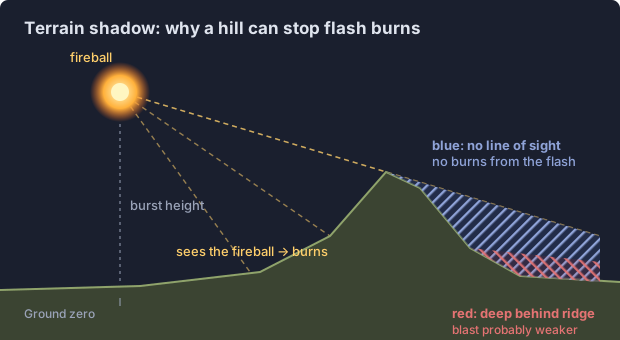
To show part of this, the map draws terrain shadows after every detonation. Using open elevation data, the simulator casts 720 rays from the fireball — at the actual burst height, with Earth curvature included — and hatches in blue every place inside the burn radius that cannot see the fireball: no line of sight means no burns from the heat flash. Buildings are not included, because no global dataset of building heights exists. Areas hidden deep behind major ridges (the line of sight passes more than 150 m below the terrain) are hatched in red inside the blast radius as a qualitative hint that the blast wave is probably weaker there; the blast rings themselves stay circular, since modelling how a shock wave bends around real terrain would require full physical simulation. On flat ground, such as most of Kyiv or Hiroshima, the shadows almost disappear — as they should.
Casualty estimates
After each detonation the simulator estimates how many people would be killed and injured. It counts the residents of every square kilometre inside the damage rings using the GHS-POP 2025 population grid (30 arc-seconds, about 1 km; European Commission, Joint Research Centre, Global Human Settlement Layer, CC BY 4.0) and applies the casualty rates by blast overpressure from the U.S. Office of Technology Assessment study The Effects of Nuclear War (1979): above 12 psi about 98% are killed; between 5 and 12 psi 50% are killed and 40% injured; between 2 and 5 psi 5% are killed and 45% injured; between 1 and 2 psi about 25% are injured. For small weapons, where prompt radiation reaches beyond the heavy-blast zone, at least half of the people inside the 500 rem ring are counted as killed.
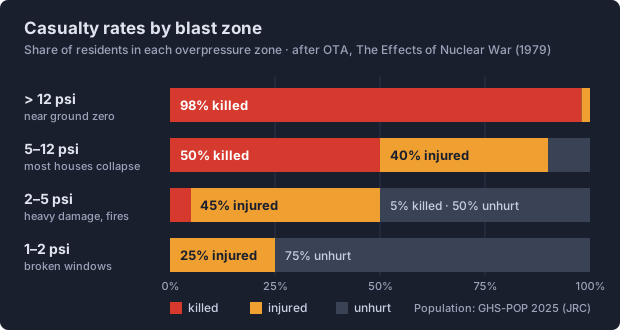
These numbers are a rough order of magnitude, not a prediction. The population grid shows where people live, so a daytime strike on a business district would affect many more; shelters, firestorms, radioactive fallout and the collapse of medical care are not modelled.
When terrain shadows are switched on, the estimate is adjusted square kilometre by square kilometre. People who cannot see the fireball are spared the flash burns, so their casualty rates are reduced by the share attributed to burns — roughly a quarter of deaths and a third of injuries, in line with estimates from Hiroshima and Nagasaki; people deep behind major ridges are counted one blast zone further out. The legend then shows both numbers. In practice the effect is modest for high airbursts and larger for low bursts in hilly cities, because most people live in valleys that still face the fireball.
Known limits
- The models are calibrated for yields between roughly 1 kiloton and 20 megatons; values outside this range are extrapolated and less reliable. The hard cap is 100 megatons.
- Casualty and damage figures assume uniform conditions — no terrain shielding, no weather, average construction.
- Results are estimates for education, not civil-defence planning. See effects of a nuclear explosion for what each mechanism does, or try the simulator to see the numbers for any city and yield.