









Méthodologie : comment le simulateur calcule les effets nucléaires
Tout ce que le simulateur trace sur la carte est calculé à partir de modèles publiés et déclassifiés des effets des armes nucléaires. Cette page explique d'où viennent les chiffres et sur quelles hypothèses ils reposent.
Sources principales
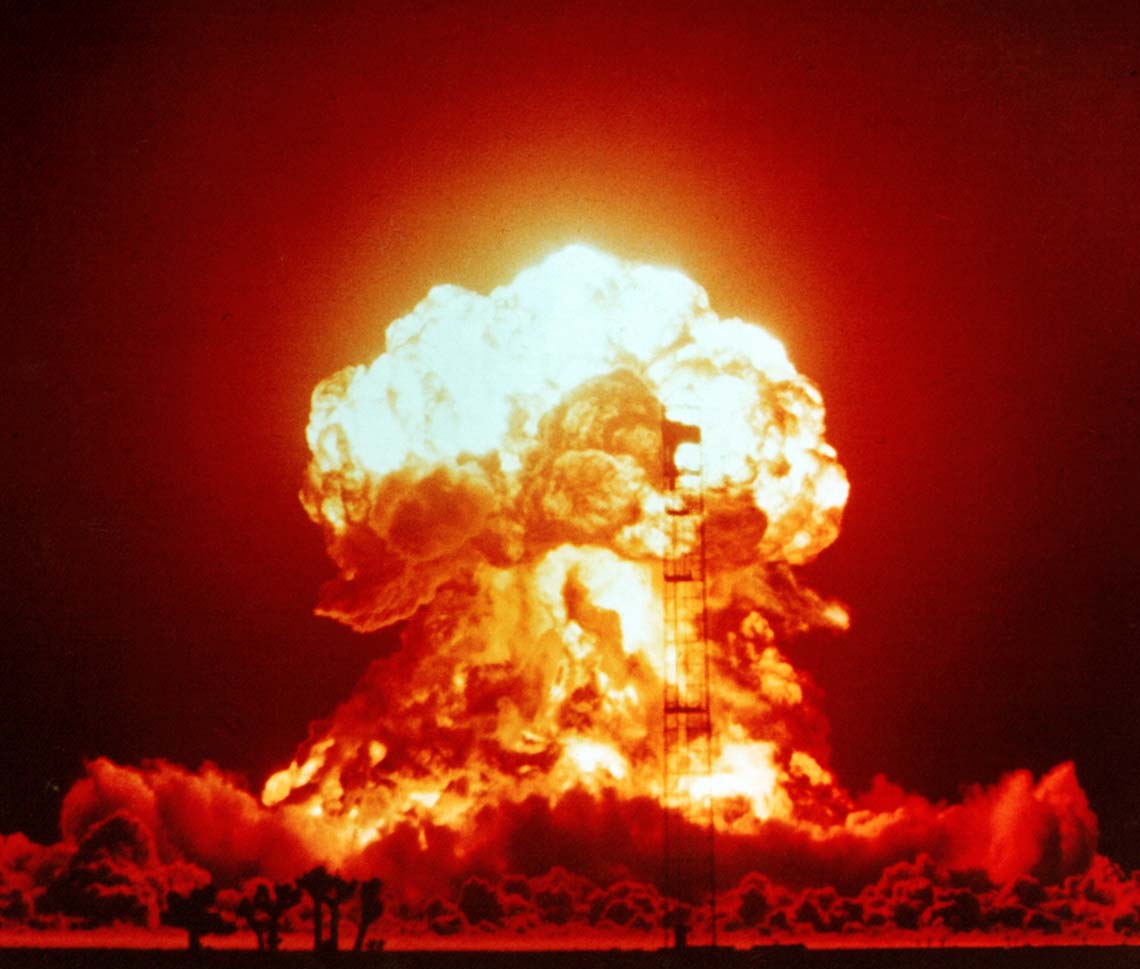
La source première est The Effects of Nuclear Weapons de Samuel Glasstone et Philip J. Dolan (3e édition, 1977), l'ouvrage de référence, autrefois officiel, du gouvernement américain sur les effets des armes nucléaires, déclassifié depuis longtemps et librement accessible. Des relations complémentaires viennent des travaux de mise à l'échelle d'E. Royce Fletcher, du rapport The Effects of Nuclear War (1979) de l'Office of Technology Assessment américain, et des équations documentées publiquement que le projet NUKEMAP d'Alex Wellerstein a popularisées.
Surpression du souffle
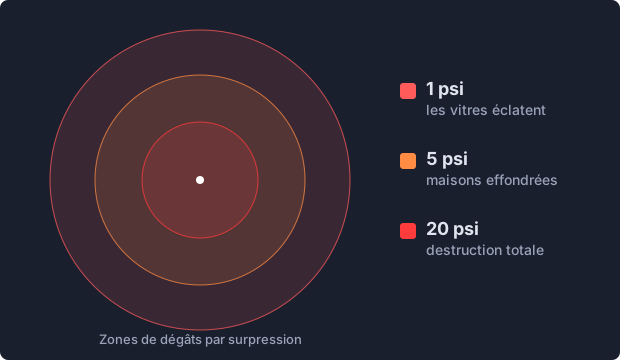
Les dégâts du souffle s'expriment en psi (livres par pouce carré) de surpression. Les distances évoluent comme la racine cubique de la puissance (loi de Hopkinson–Cranz) : une bombe 8 fois plus puissante ne repousse chaque anneau de pression que 2 fois plus loin. Les anneaux par défaut du simulateur correspondent à des repères de dégâts bien établis : 20 psi : bâtiments en béton armé détruits, mortalité proche de 100 % ; 5 psi : la plupart des habitations s'effondrent ; 1 psi : les vitres éclatent et blessent. Pour les explosions aériennes, le modèle peut optimiser l'altitude de l'explosion afin de maximiser le rayon d'une surpression donnée.
Rayonnement thermique
Les anneaux thermiques indiquent la distance oblique à laquelle l'impulsion de chaleur délivre assez d'énergie (en cal/cm²) pour provoquer, avec une probabilité donnée, des brûlures du premier, deuxième ou troisième degré, ou pour enflammer du bois sec. L'énergie nécessaire croît lentement avec la puissance, car les grosses explosions émettent leur impulsion plus longtemps. Le modèle suppose une atmosphère raisonnablement claire ; brume, nuages et ombres modifient sensiblement les résultats réels.
Rayonnement ionisant
Les anneaux de rayonnement indiquent la distance à laquelle la bouffée initiale de neutrons et de rayons gamma délivre une dose immédiate donnée (en rem). Des doses de 500 à 600 rem sont généralement mortelles sans soins intensifs. Pour les armes de forte puissance, les rayons létaux du souffle et de la chaleur s'étendent bien au-delà de celui du rayonnement immédiat ; c'est pourquoi cet effet compte surtout pour les petites armes de la classe d'Hiroshima.
Retombées
Le panache de retombées est modélisé pour les explosions au sol (une explosion aérienne dont la boule de feu ne touche pas le sol produit peu de retombées locales). Les entrées sont la puissance, la fraction de fission, la vitesse et la direction du vent ; la sortie est un ensemble de courbes de débit de dose en rads par heure, ramenées à une heure après l'explosion (« H+1 »), selon l'approche simplifiée de type SIMFIC décrite dans la littérature ouverte. Les retombées réelles sont bien plus désordonnées : elles dépendent des vents à chaque altitude, de la pluie et du relief.
Relief et bâtiments
Chaque anneau de la carte est calculé pour un terrain plat et dégagé, ce qui est aussi le cas des modèles de référence classiques. Le paysage réel change la donne. L'éclair thermique se propage en ligne droite : tout ce qui se trouve derrière une crête ou un bâtiment massif est protégé des brûlures, tandis que les versants exposés face à la boule de feu peuvent être frappés plus durement. L'onde de choc contourne les obstacles, mais les collines l'affaiblissent tout de même sur leur versant opposé, et les vallées comme les longues rues rectilignes peuvent la canaliser. Nagasaki en est l'exemple d'école : la bombe a explosé au-dessus de la vallée d'Urakami, les collines environnantes ont contenu une bonne part de la destruction, et le centre-ville, derrière elles, a été bien moins touché que ne le laisseraient penser les seuls anneaux. Les quartiers denses de grands immeubles ajoutent leur propre écran et leurs propres débris. Voyez les anneaux comme une estimation d'échelle pour une ville plate idéalisée, pas comme une carte des dégâts rue par rue.
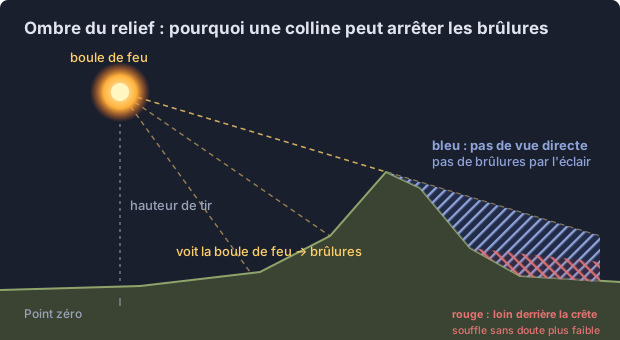
Pour en rendre compte en partie, la carte dessine des ombres de relief après chaque explosion. À partir de données d'altitude publiques, le simulateur lance 720 rayons depuis la boule de feu (à l'altitude réelle de l'explosion, courbure de la Terre comprise) et hachure en bleu chaque endroit du rayon de brûlure d'où la boule de feu est invisible : pas de ligne de visée, pas de brûlures par l'éclair. Les bâtiments ne sont pas pris en compte, faute de base de données mondiale des hauteurs de bâtiments. Les zones cachées loin derrière de grandes crêtes (la ligne de visée passe plus de 150 m sous le terrain) sont hachurées en rouge à l'intérieur du rayon de souffle, comme indication qualitative que l'onde de choc y est probablement plus faible ; les anneaux de souffle eux-mêmes restent circulaires, car modéliser la manière dont une onde de choc contourne le relief réel demanderait une simulation physique complète. Sur terrain plat, comme la majeure partie de Kiev ou d'Hiroshima, les ombres disparaissent presque, comme il se doit.
Estimation des victimes
Après chaque explosion, le simulateur estime le nombre de morts et de blessés. Il compte les habitants de chaque kilomètre carré situé dans les anneaux de dégâts à partir de la grille de population GHS-POP 2025 (30 secondes d'arc, soit environ 1 km ; Commission européenne, Centre commun de recherche, Global Human Settlement Layer, CC BY 4.0) et applique les taux de victimes par surpression de l'étude The Effects of Nuclear War (1979) de l'Office of Technology Assessment américain : au-delà de 12 psi, environ 98 % de morts ; entre 5 et 12 psi, 50 % de morts et 40 % de blessés ; entre 2 et 5 psi, 5 % de morts et 45 % de blessés ; entre 1 et 2 psi, environ 25 % de blessés. Pour les petites armes, dont le rayonnement immédiat dépasse la zone de dégâts graves du souffle, au moins la moitié des personnes situées dans l'anneau de 500 rem sont comptées comme mortes.
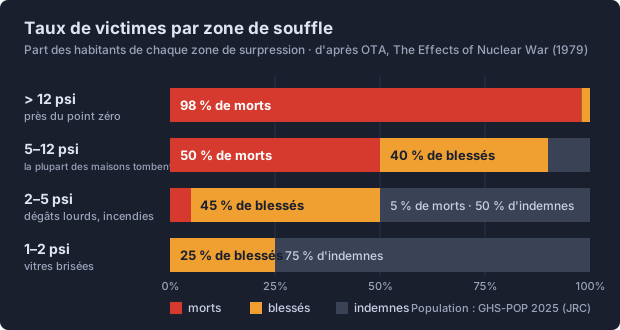
Ces chiffres donnent un ordre de grandeur grossier, pas une prédiction. La grille de population indique où les gens habitent : une frappe en journée sur un quartier d'affaires toucherait bien plus de monde ; les abris, les tempêtes de feu, les retombées radioactives et l'effondrement du système de soins ne sont pas modélisés.
Quand les ombres de relief sont activées, l'estimation est ajustée kilomètre carré par kilomètre carré. Les personnes qui ne voient pas la boule de feu échappent aux brûlures par l'éclair : leurs taux de victimes sont réduits de la part attribuée aux brûlures, soit environ un quart des morts et un tiers des blessés, conformément aux estimations d'Hiroshima et de Nagasaki ; celles qui se trouvent loin derrière de grandes crêtes sont comptées une zone de souffle plus loin. La légende affiche alors les deux chiffres. En pratique, l'effet est modeste pour les explosions aériennes hautes et plus marqué pour les explosions basses sur des villes vallonnées, car la plupart des gens vivent dans des vallées qui restent tournées vers la boule de feu.
Limites connues
- Les modèles sont calibrés pour des puissances allant d'environ 1 kilotonne à 20 mégatonnes ; hors de cette plage, les valeurs sont extrapolées et moins fiables. Le plafond absolu est de 100 mégatonnes.
- Les chiffres de victimes et de dégâts supposent des conditions uniformes : pas d'écran du relief, pas de météo, construction moyenne.
- Les résultats sont des estimations à visée pédagogique, pas un outil de planification de la protection civile. Consultez les effets d'une explosion nucléaire pour ce que fait chaque mécanisme, ou essayez le simulateur pour obtenir les chiffres de n'importe quelle ville et puissance.